Intercom: giving customers control of their spending
Usage and cost visualisation so customers know what they'll pay before the invoice arrives.
- Company
- Intercom
- Year
- 2024
- Team
- Design, PM and Engineering
My role
Led product design: research, system mapping, concepts, end-to-end design, and usability testing
Outcome
- Still Intercom's Usage page 2+ years after launch
- Pattern extended to new metrics like Fin AI outcomes
- Led to usage alerts and limits, now live
Problem
Intercom’s new pricing introduced usage-based charges: customers pay for what they use, measured by metrics like emails sent, messages sent, and AI bot resolutions. But they couldn’t see their usage or its cost until the invoice arrived:
- No visibility. Customers couldn’t tell how usage was trending, or how close they were to their included or contracted amounts.
- Surprise bills. Spikes only showed up on the invoice, and each one became a support ticket that needed a manual investigation.
For Intercom, that meant support and billing time, and it worked against the company goal of transparent billing.
Solution
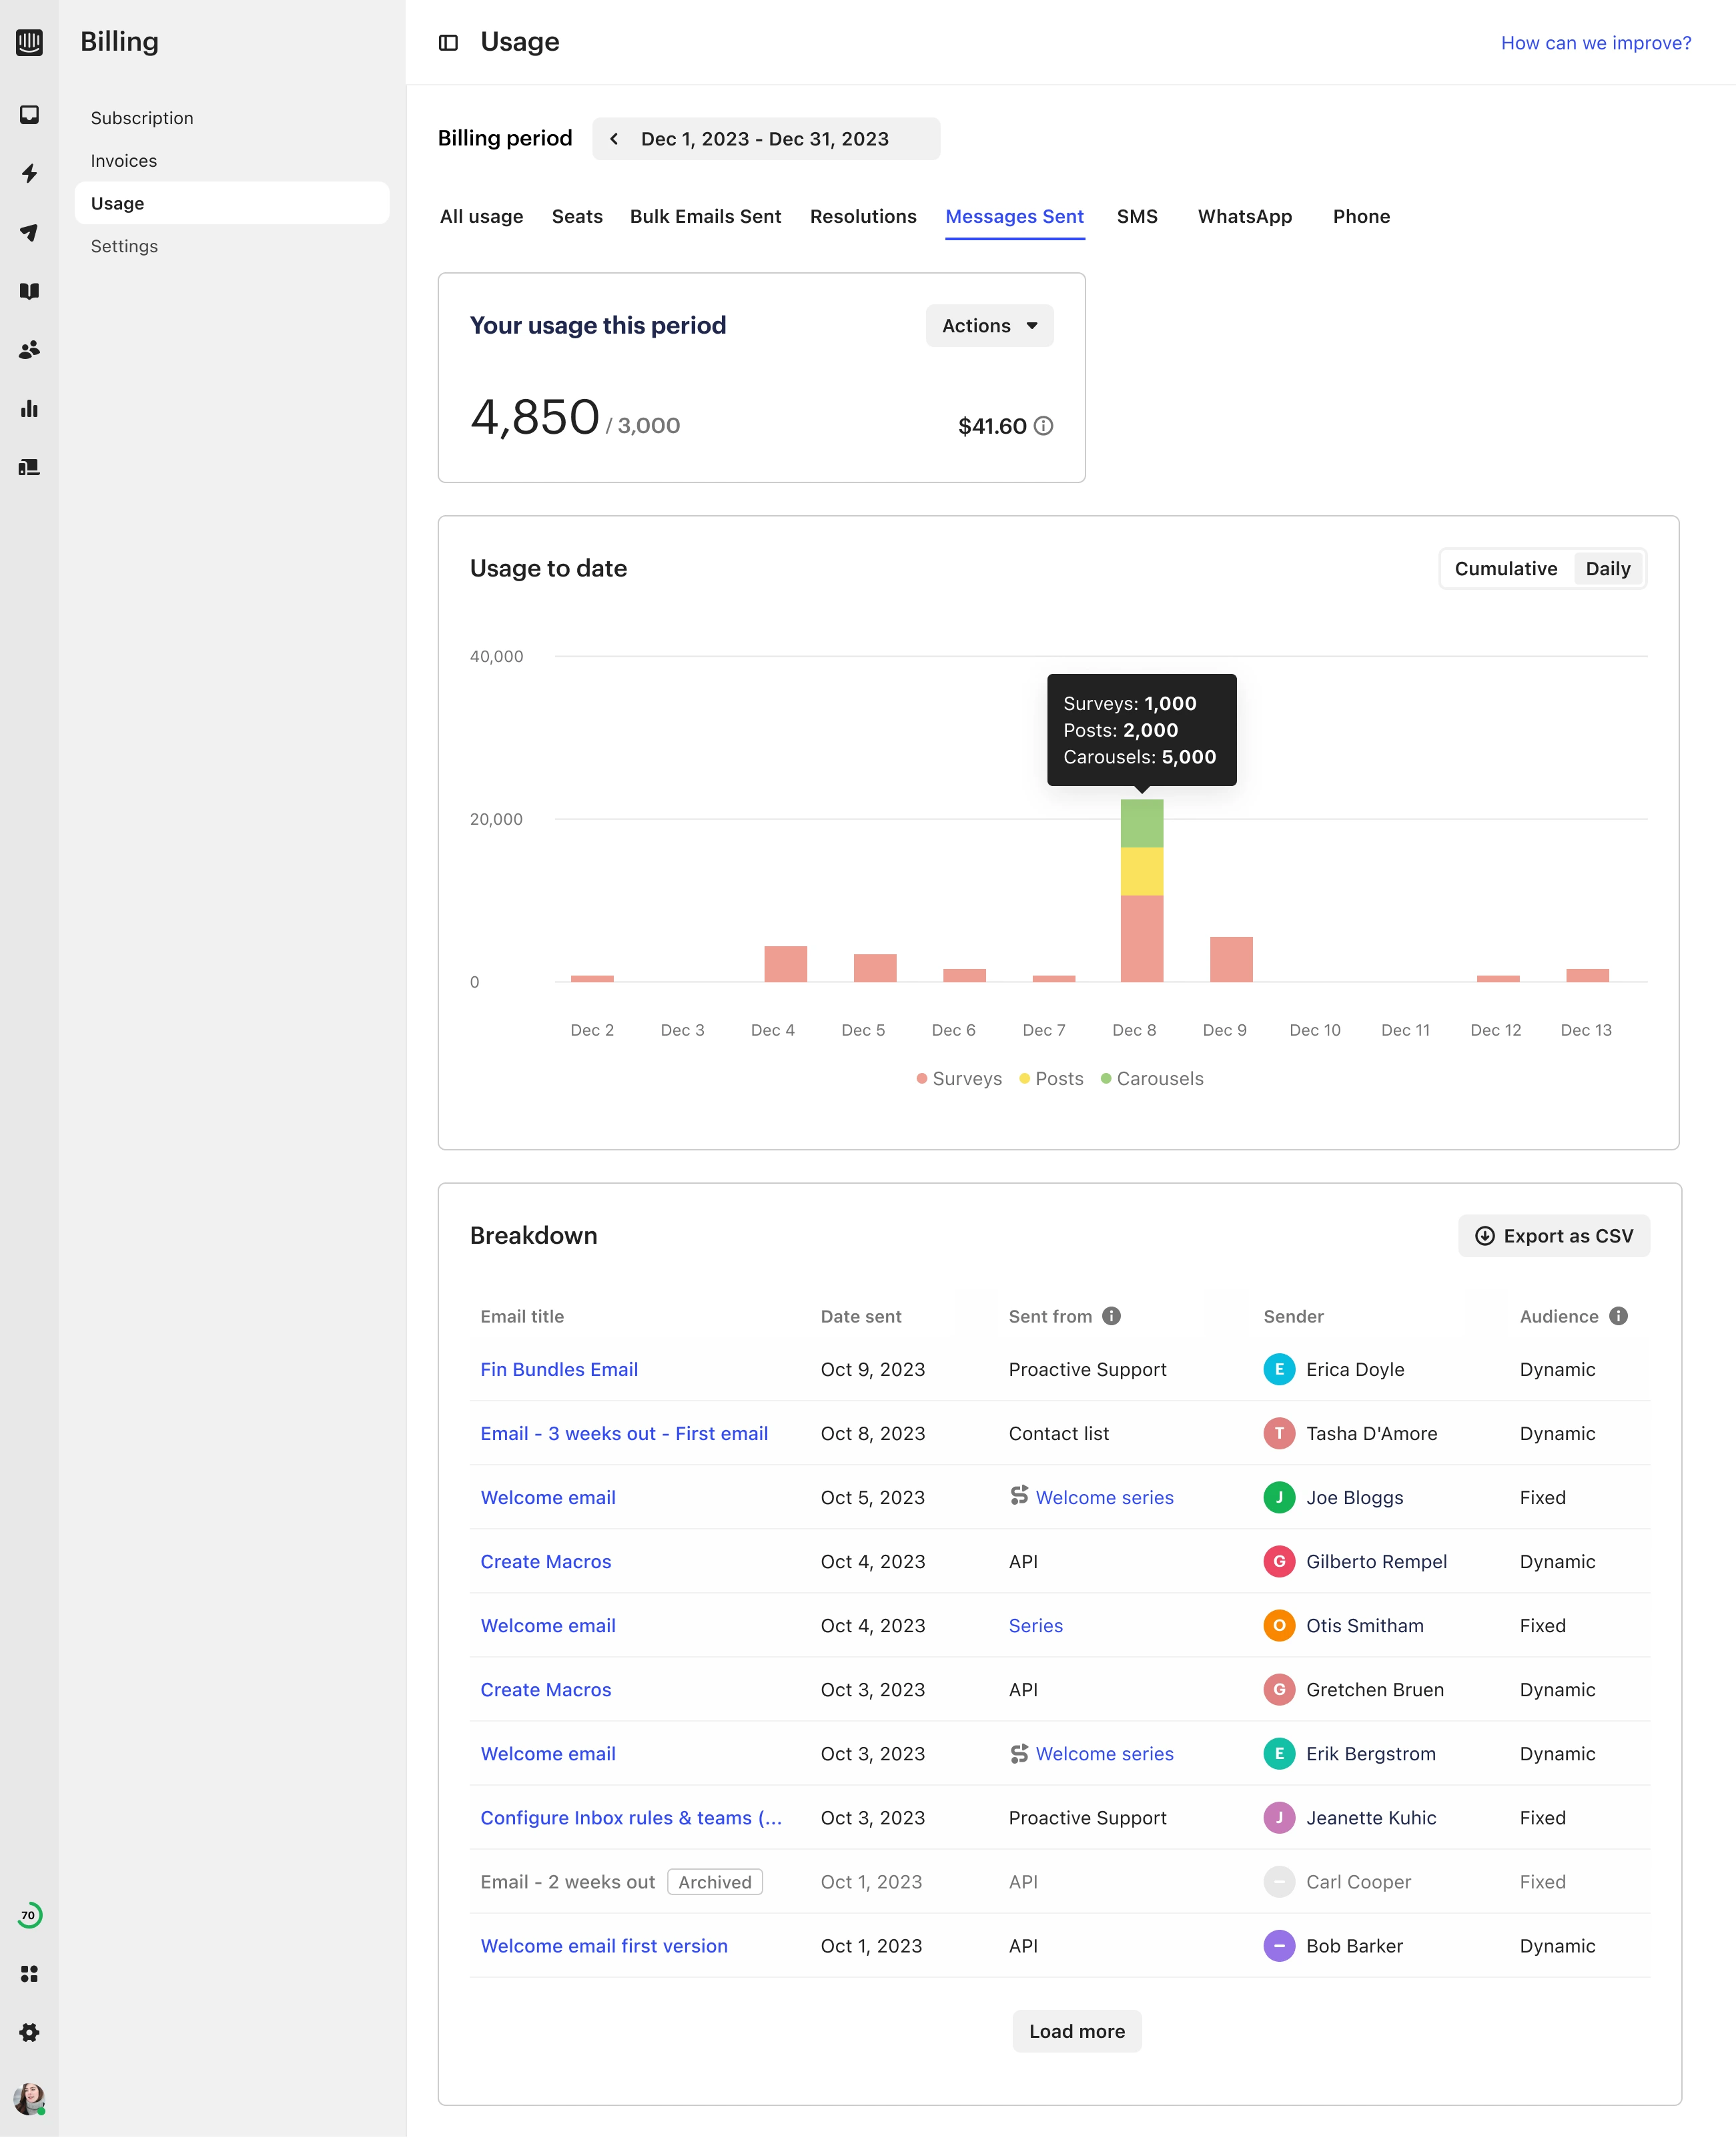
A usage dashboard for bill managers. It shows usage and cost per metric, how they trend across the billing cycle, and how close the customer is to their included or contracted amounts, so they can act before the invoice.
Key decisions
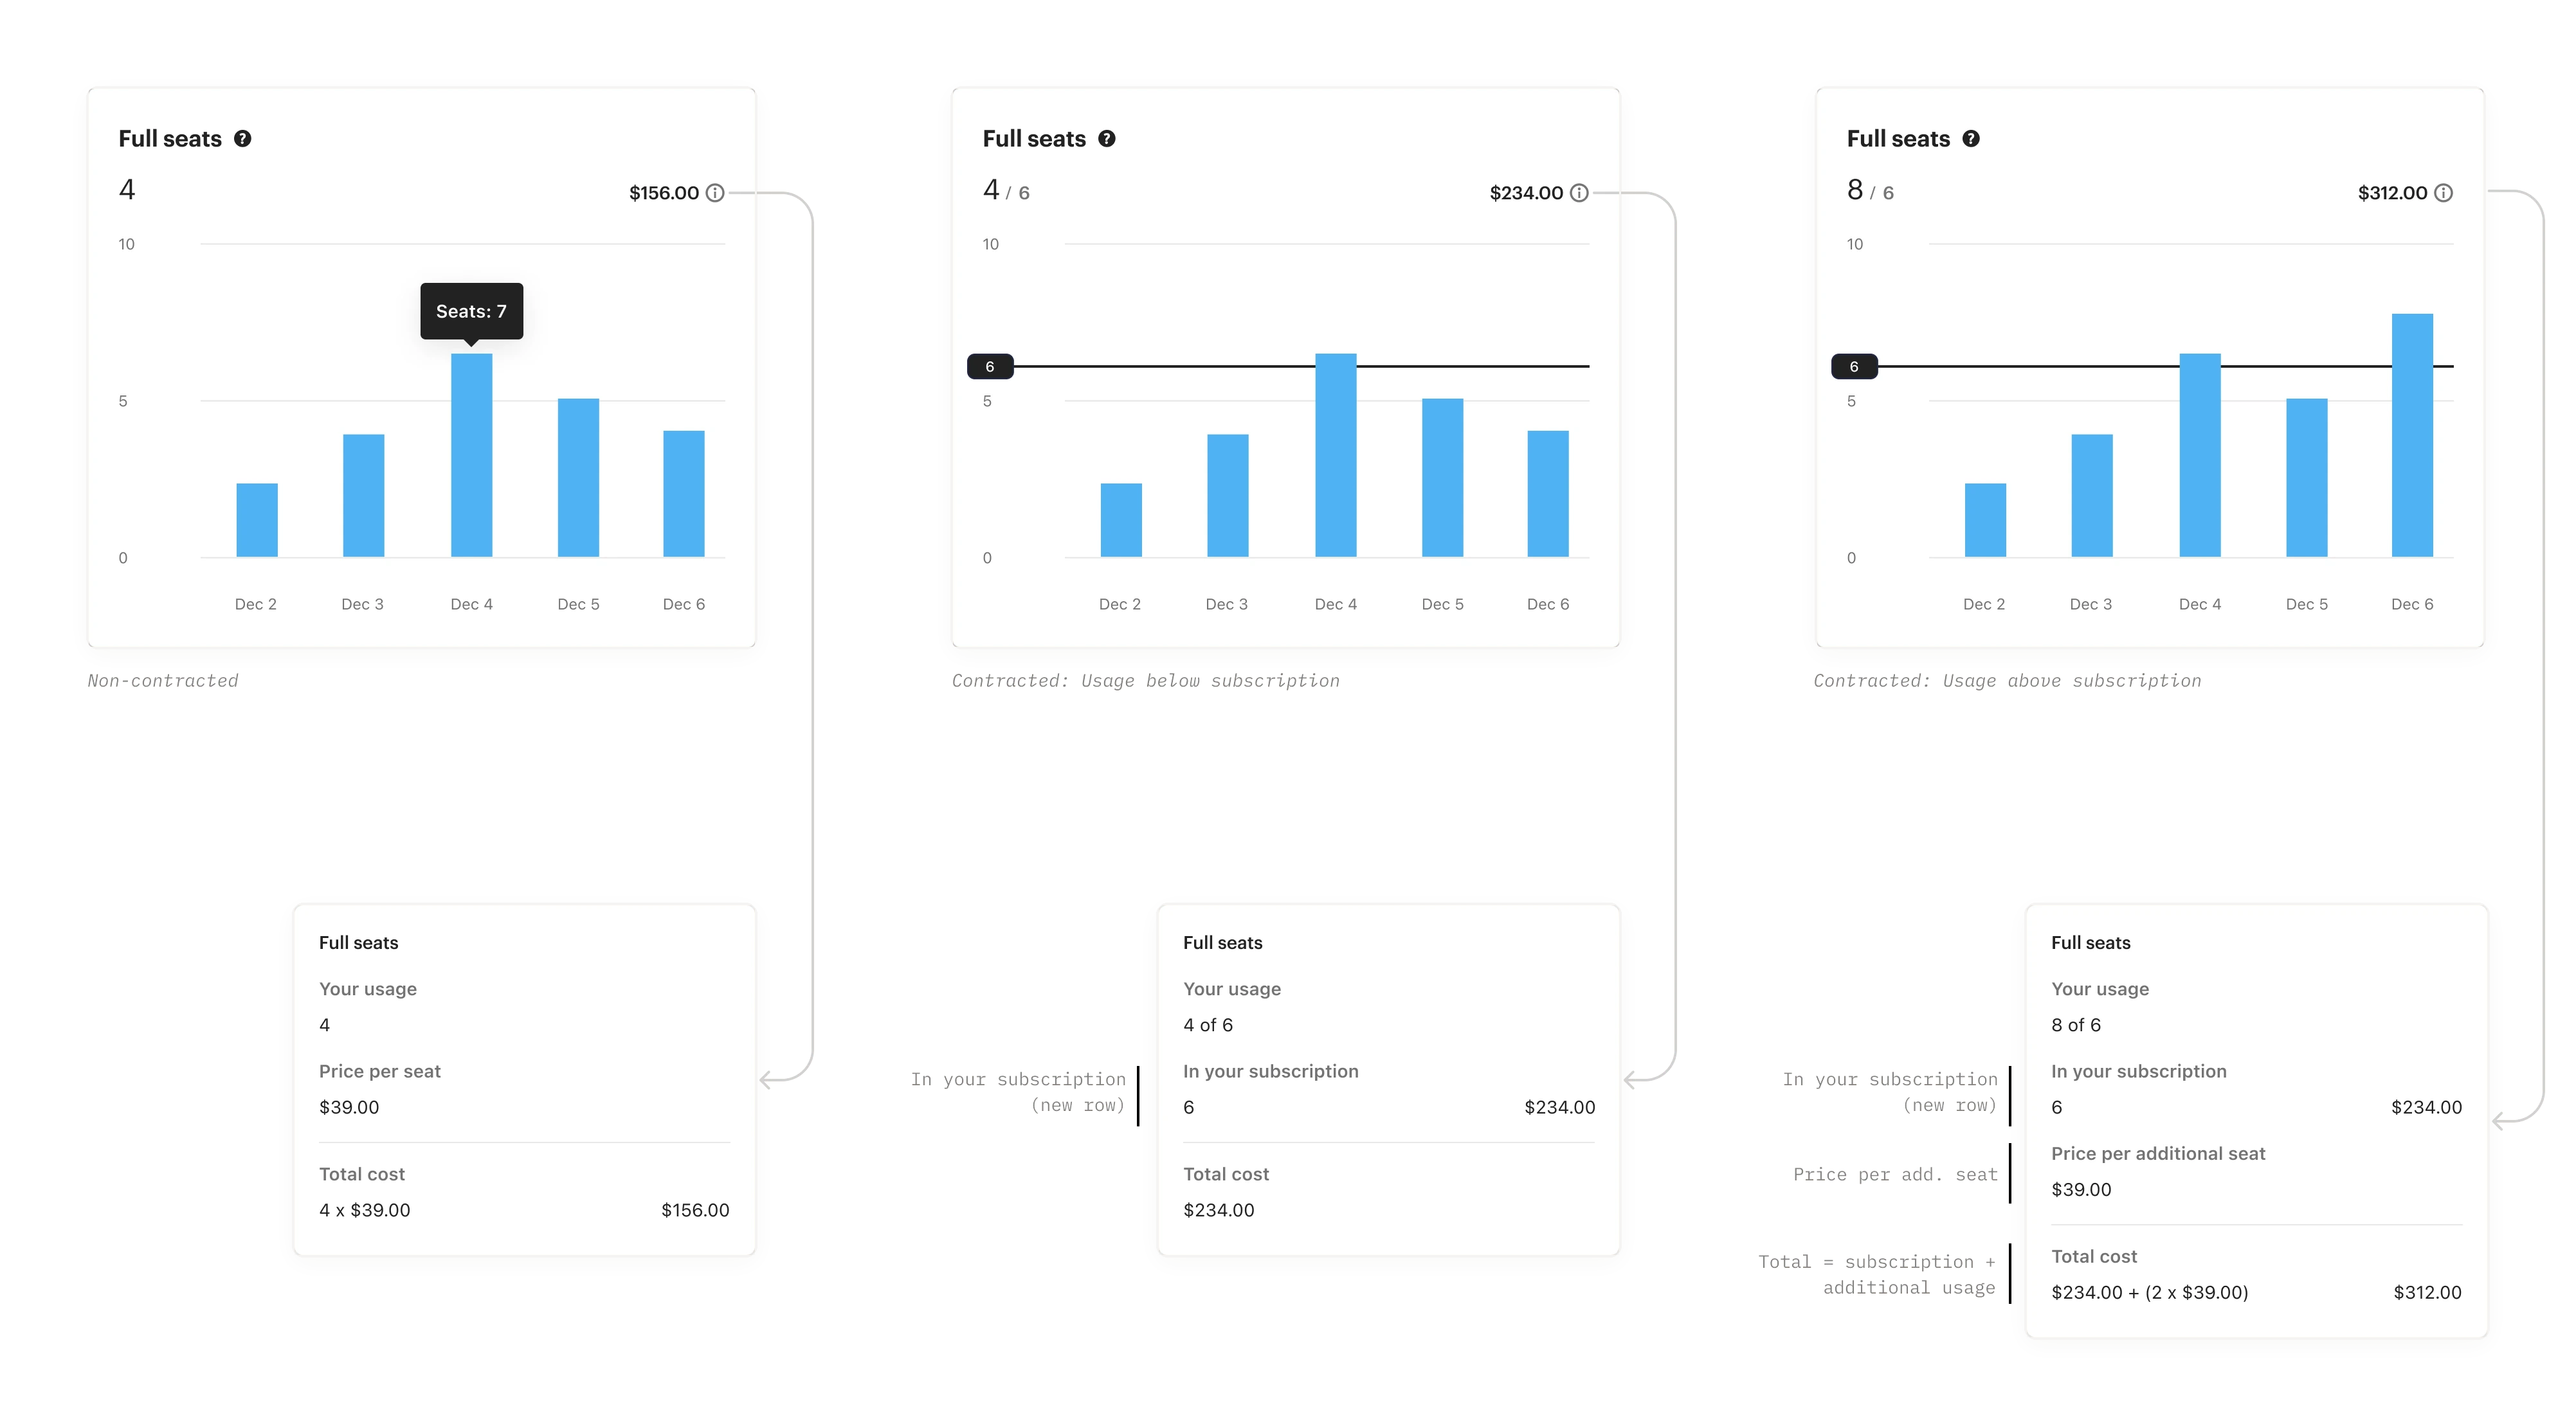
- One pattern for every metric. Each of the 7+ metrics had its own pricing, inclusions and edge cases, and contracted customers work differently from self-serve ones. Rather than design each metric on its own, I decided to treat every metric as one reusable unit. The same building blocks (the contracted amount, the limit line, and cumulative or per-period charts) adapt to each metric, and I mapped every edge case against them.
- Billing, not Reports. Usage could have lived in Reports, next to Intercom’s other analytics. I recommended Billing instead: the data had to follow the billing cycle, and usability tests showed bill owners expected to find it there.
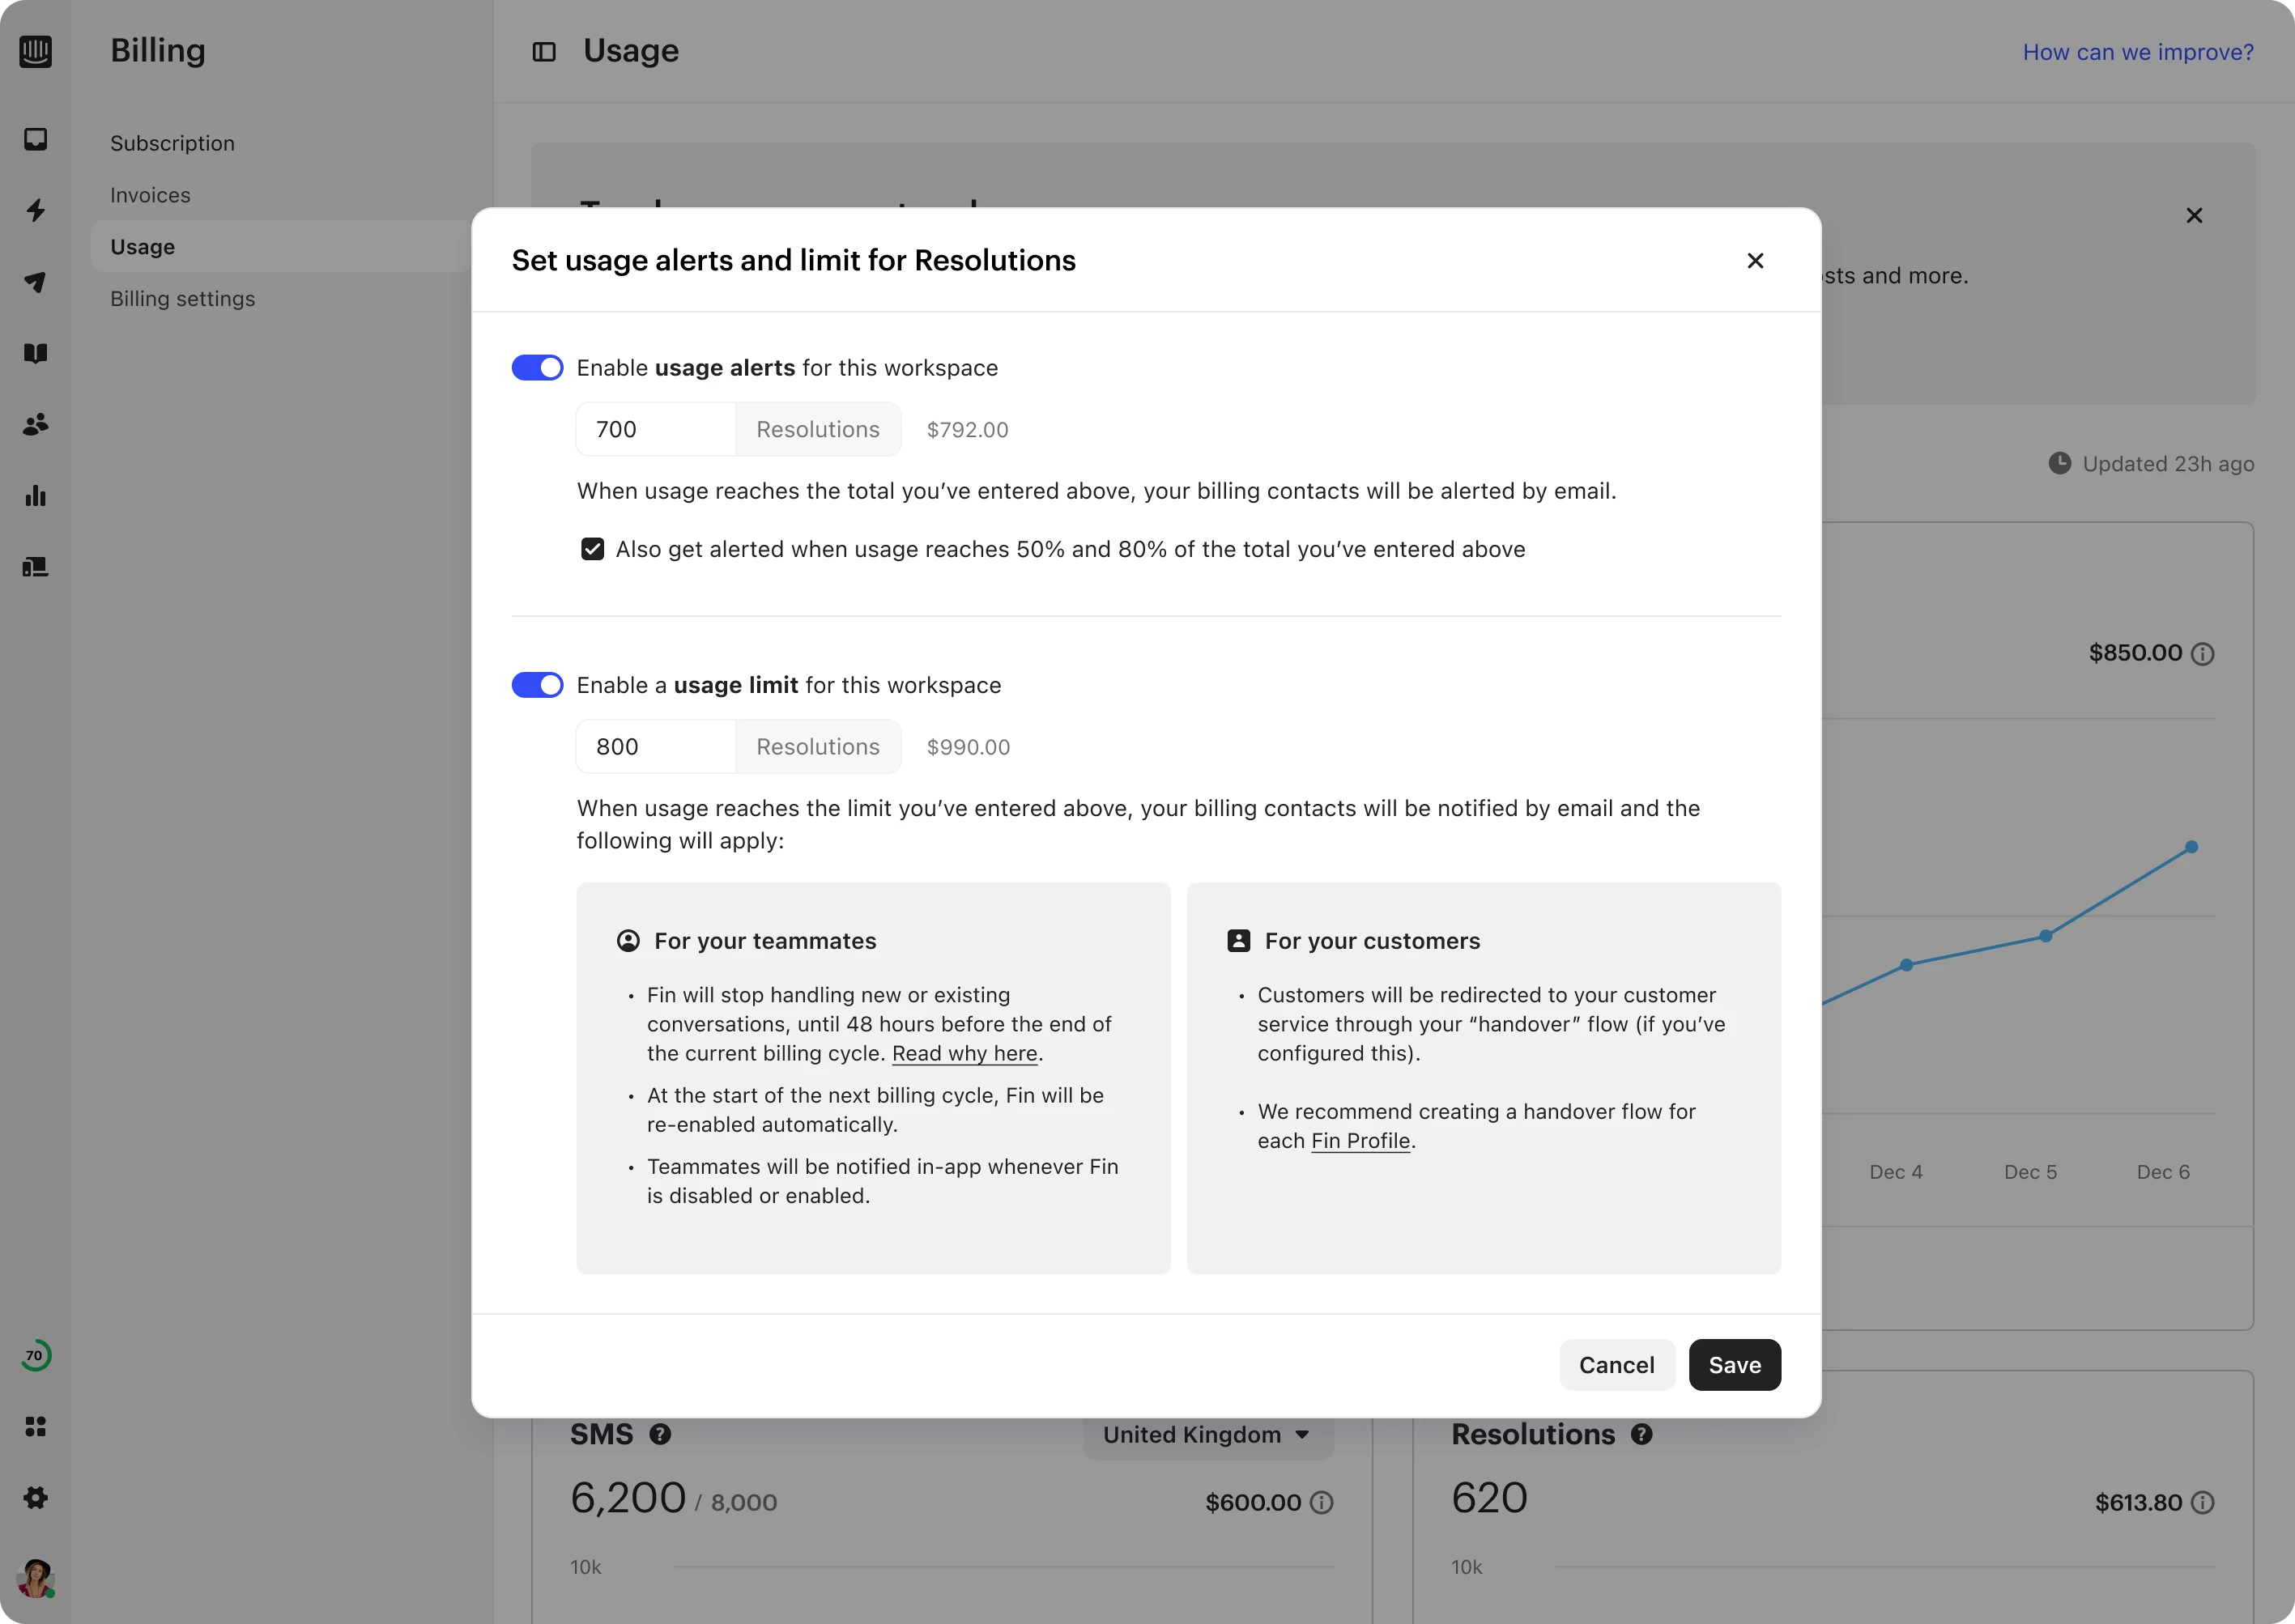
- A hard limit, not just alerts. Once customers could see their usage, the next step was letting them control it. I proposed approaches ranging from light notifications to a hard limit that pauses usage, and recommended the hard limit, which is what we built, starting with Fin.
How I led it
I led product design, working with a PM and engineers.
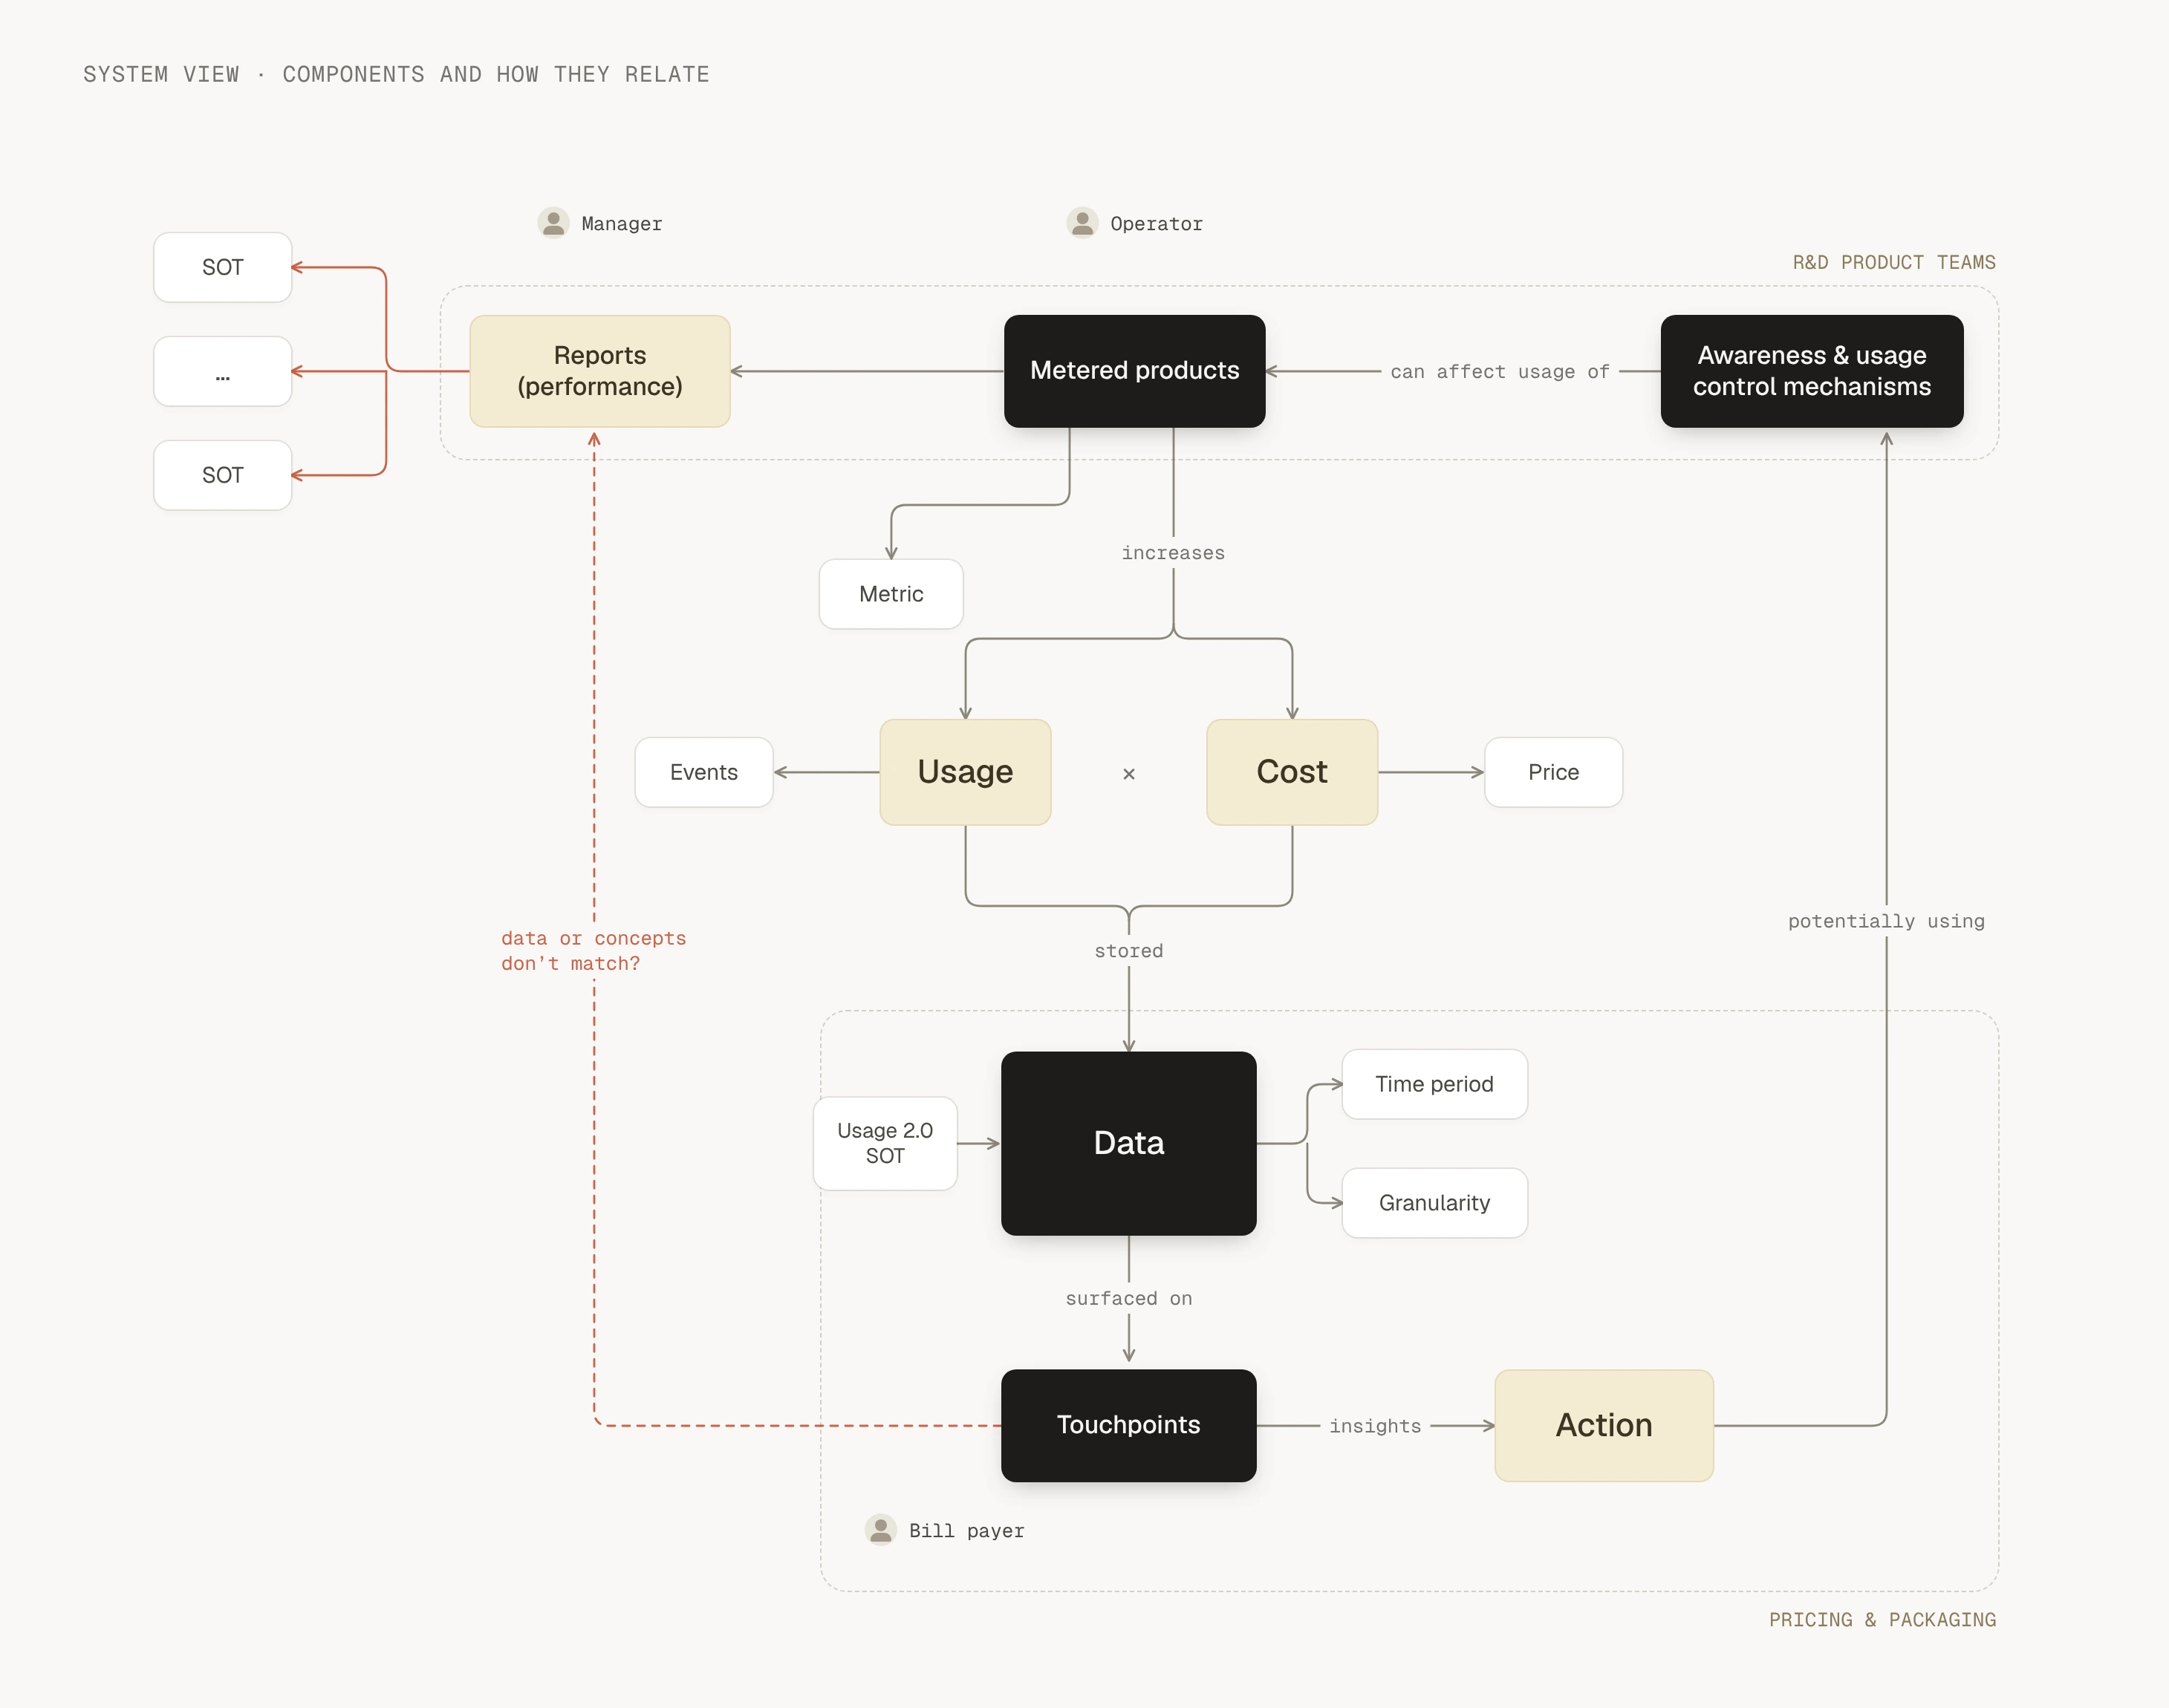
- Mapped the whole system first. Billing touches many parts of Intercom. From desk research and interviews with sales and support, I built a journey map and a system view of the actors, systems and data involved. It surfaced the affected areas, the teams we needed, and data inconsistencies early, and anchored an ideation workshop with billing, product and design.
- Validated with customers. I tested the concept in customer interviews, then ran rounds of unmoderated usability tests as the detailed design took shape.
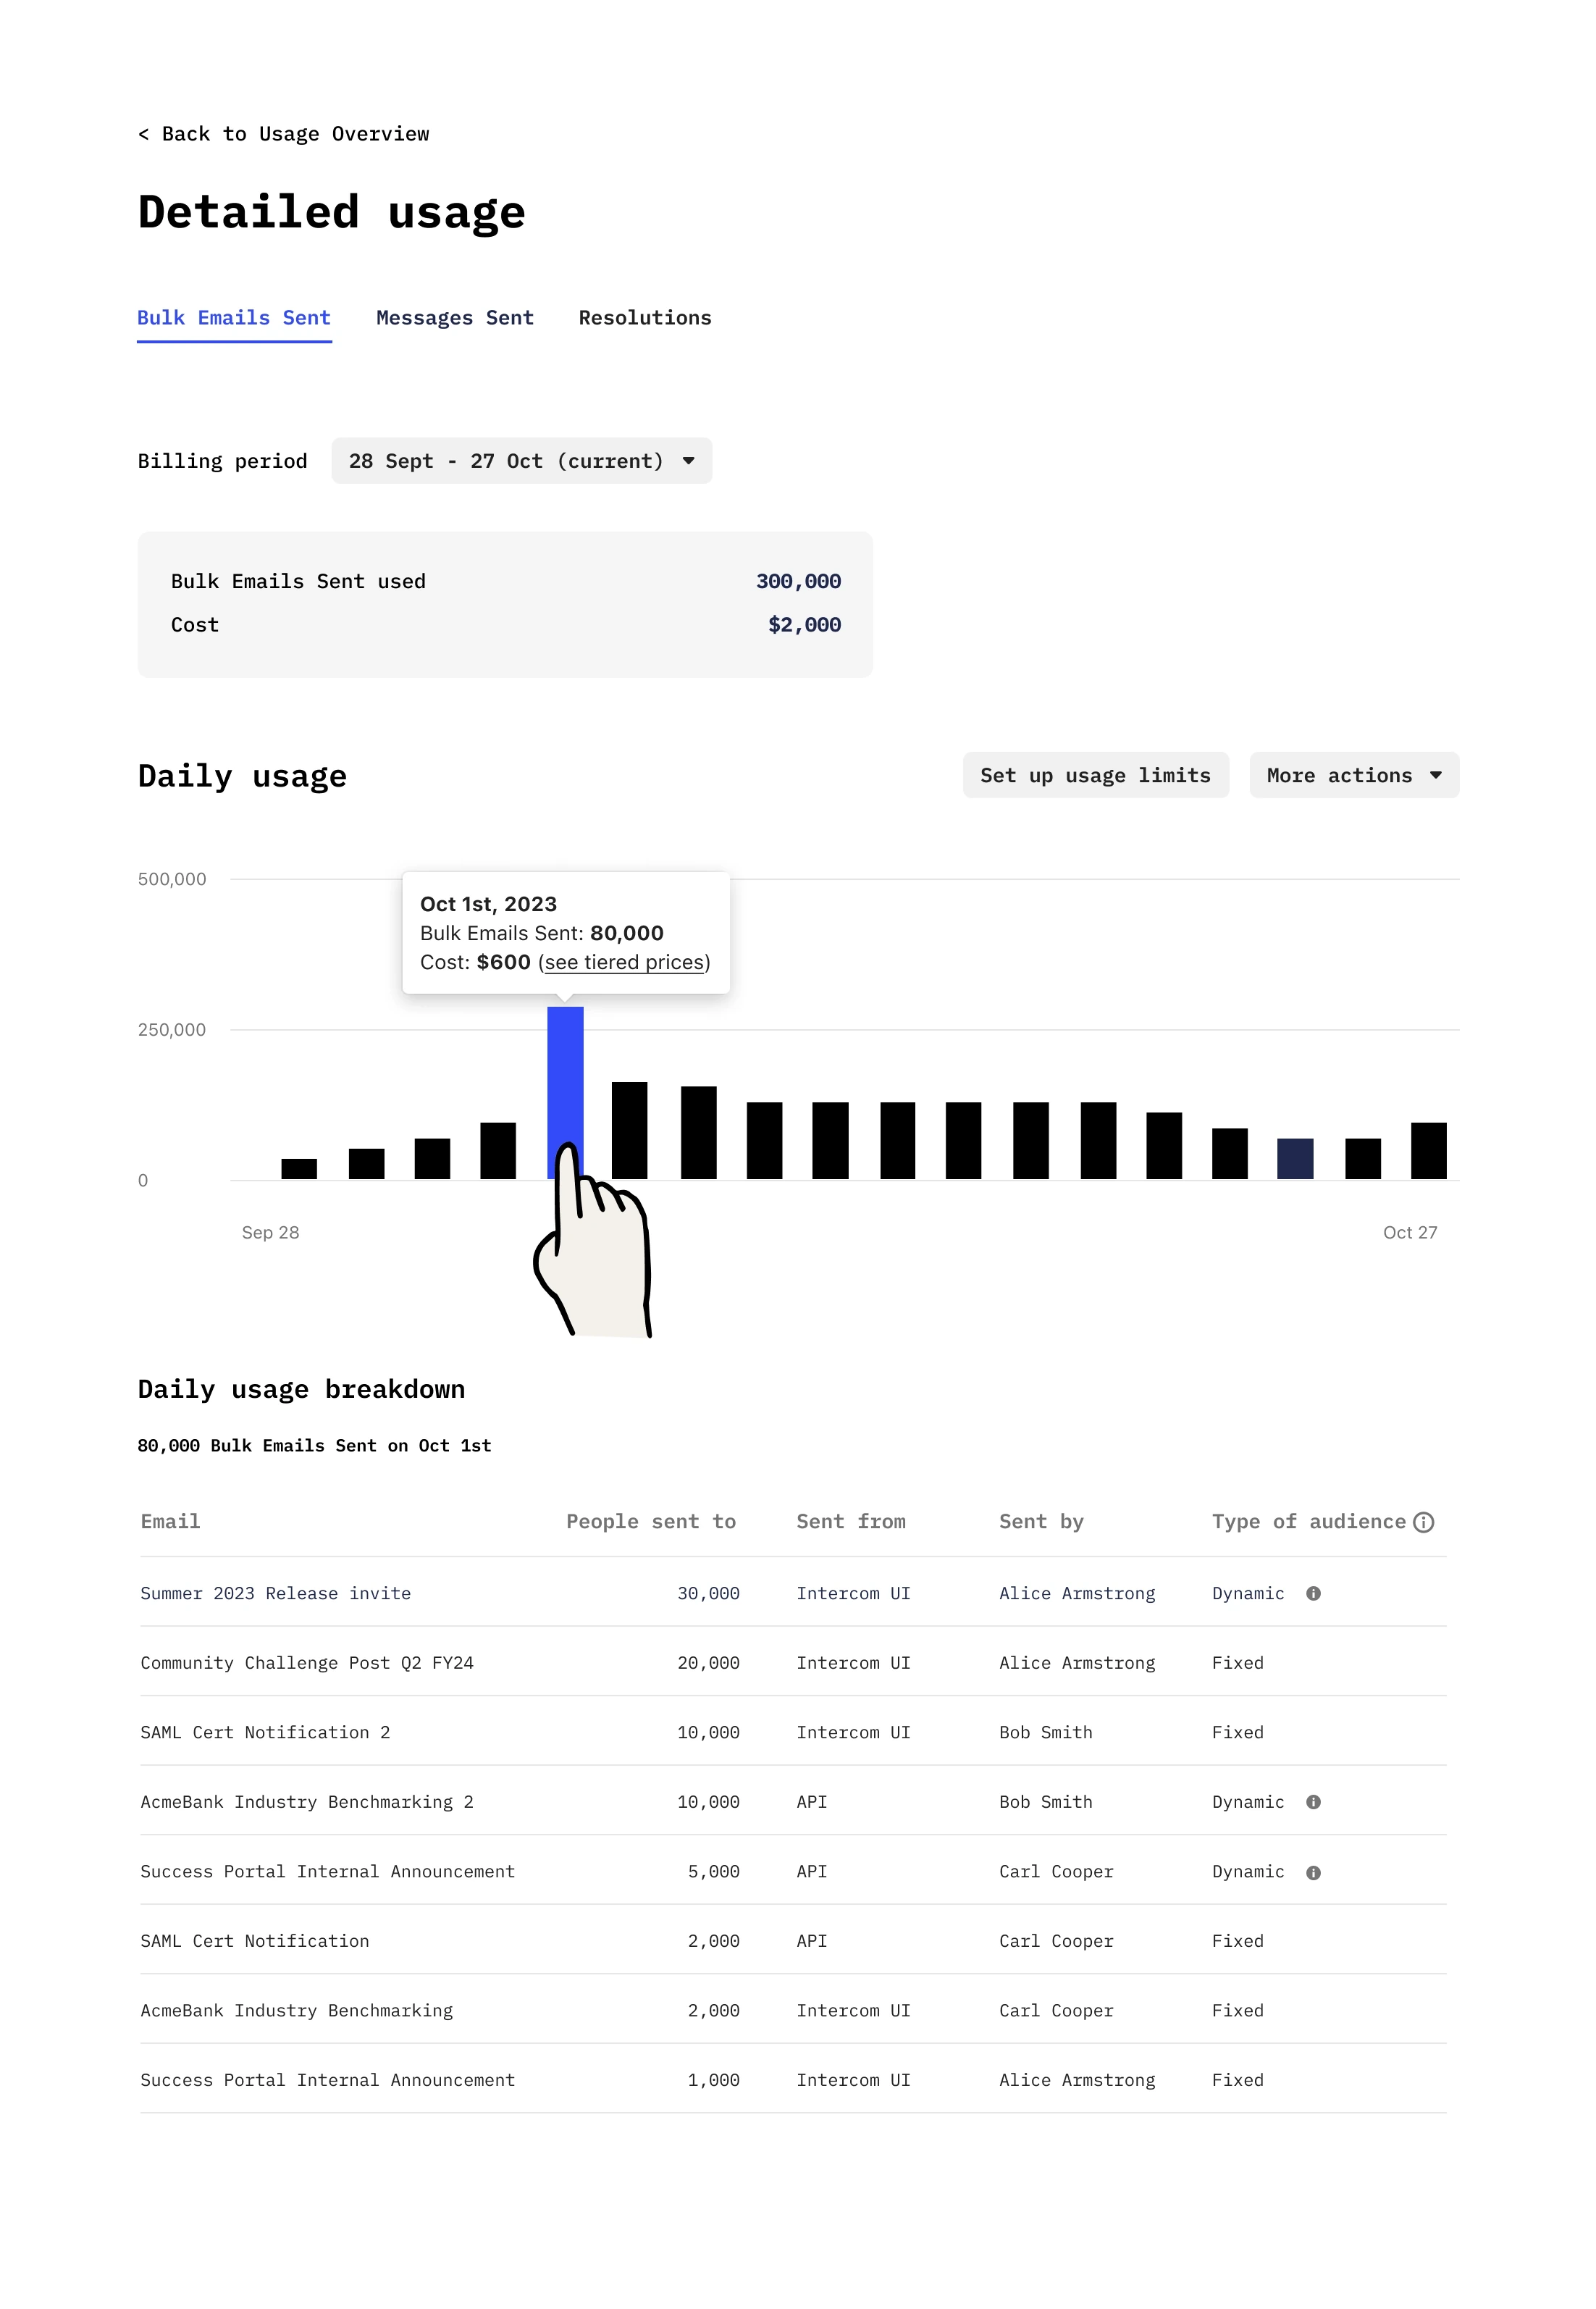
- Adapted when the data fell through. Mid-project, we learned that the event-level data for a full breakdown (which emails were sent, by whom, at what cost) wouldn’t be ready in time. As a team, we re-planned V1 to cover every metric at a lighter level, and moved the detailed breakdown to V2.
- Carried it to release. I designed the entire solution, covering every metric and its different cases for both self-serve and contracted customers, through to launch.
- Added control after V1. I designed alerts and limits end to end, mapping what a limit means across the product, from paused emails to Fin handing conversations back to the team.
Outcome
V1 shipped in March 2024 across all 7+ usage metrics, so customers could see their usage and costs before the invoice. Over two years later it’s still Intercom’s Usage page. The styling has changed, but the foundation is the same, and the chart pattern, including the contracted-limit line, now covers new metrics such as Fin AI outcomes. The alerts and limits I designed next shipped too, starting with Fin, and are part of the Usage section today.
Reflection
The lesson from moving the breakdown to V2: when a design depends on data that’s still being built, plan a version that works without it from the start, so a late change costs less rework. What worked was the reusable pattern: because one structure held every metric, V1 could still cover all of them.